
Photo courtesy of The Guardian
The latest Sri Lanka Opinion Tracker Survey (SLOTS) carried out by the Institute for Health Policy (IHP) by the polling in January 2023 shows the NPP/JVP and SJB running neck and neck in a general election with voting intentions among likely voters at 32% and 31% each respectively. Both are ahead of the SLPP, UNP and SLFP but neither has gained more than a third of likely voters, and the difference between them is within the margin of error.
| General election voting intention, January 2023 (% likely voters)
If there was a general election today, which party would you vote for? |
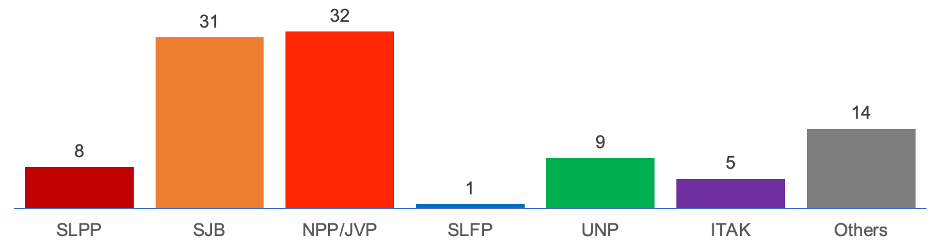 |
| Institute for Health Policy Sri Lanka Opinion Tracker Survey MRP
January 2023 estimates based on 724 interviews conducted in Jan. 2023, and 9,710 interviews conducted overall from 31 Aug. 2021–16 Feb. 2023. Estimates generated using Multilevel Regression and Post-Stratification (MRP) (IHP Model G) to match likely national voters, with margin of error assessed as 2–3%. |
IHP MRP analysis of likely voters indicates that since July 2022 when President Ranil Wickremesinghe took office, the SJB has gained three points, the NPP/JVP one point and the UNP five points. This has largely been at the expense of the SLPP whose support fell 11 points.
| IHP SLOTS general election voting intention tracker (% likely voters)
If there was a general election today, which party would you vote for? |
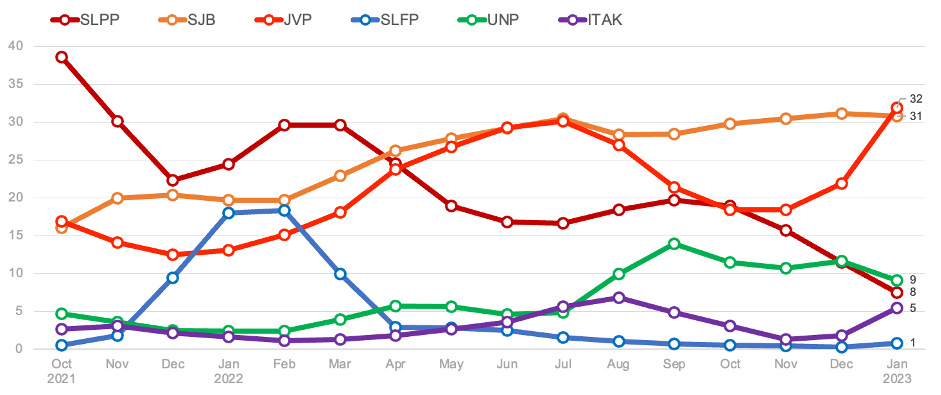 |
| Institute for Health Policy Sri Lanka Opinion Tracker Survey MRP
Monthly estimates based on 9,710 interviews conducted from 31 Aug. 2021–16 Feb. 2023. Estimates generated using IHP’s MRP model G to match the national population, with margin of error assessed as 2–5% depending on month and party. |
Assuming general election voting intent transfers to voting in local authority elections due in March, our January polling suggests that the SJB and the NPP/JVP between them will win the plurality in most local authorities and wards. However, most local authorities are likely to end up with divided control with no party winning an absolute majority. The SJB and ITAK will lead the NPP/JVP in the Northern and Eastern provinces but the NPP/JVP is likely to lead the SJB in the Western, Southern, North-Central, and Sabaragamuwa Provinces and will do better in rural areas, while the SJB will do better in urban and municipal councils.
Assuming the local authority elections in March reflect these general election vote preferences, they will represent a huge change from the previous 2018 results, which were dominated by the SLPP. There are five factors driving this change.
First, less than one in seven 2020 SLPP voters intend to vote for the party with this being less than one in 10 of Tamil and Muslim SLPP voters.
Second, defecting SLPP voters prefer the NPP/JVP (35%) more than the SJB (19%). These are primarily Sinhala voters with Tamil and Muslim ex-SLPP voters preferring the SJB to the NPP/JVP.
| Less than one in seven 2020 SLPP voters intend to vote for the party today. One in three have switched to the NPP/JVP and one in five to the SJB
If there was a general election today, which party would you vote for? % of those who voted SLPP in 2020 |
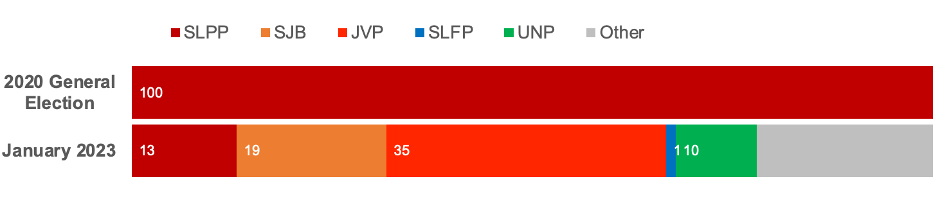 |
| Institute for Health Policy Sri Lanka Opinion Tracker Survey MRP
Based on 724 interviews conducted in Jan. 2023. Analysis using MRP (IHP Model G), with margin of error for shares assessed as 3–5%. |
Third, 2020 SLPP voters are 10–15% more likely than other voters to say they will not vote, further depressing the likely SLPP vote. NPP/JVP voters are also less likely to vote than SJB voters, reducing its margin in likely voters by 2%.
Fifth, the NPP/JVP is doing better than other parties in holding onto its 2020 supporters with 56% of its previous voters preferring the NPP/JVP compared with SJB which retains the loyalty of just 36% of its 2020 voters. The UNP has done even worse, retaining only one in ten of its 2020 voters but this has been more than compensated by defecting 2020 SLPP voters who contribute the largest share of its current support base.
A consequence of these movements is that the current support base of all the major opposition parties except the SJB and ITAK is dominated by former SLPP voters. It suggests that most of these voters have not yet found a permanent home. The fluctuations in support for the NPP/JVP in recent months, which first peaked in July before falling, and then again surging in the past three months would suggest that the support of these voters remains fickle and very much in play.
| Half or more of voters who support the NPP/JVP, SLFP and UNP in January 2023 previously voted for the SLPP in 2020
If there was a general election today, which party would you vote for? % of supporters by which party they voted for in the 2020 general elections |
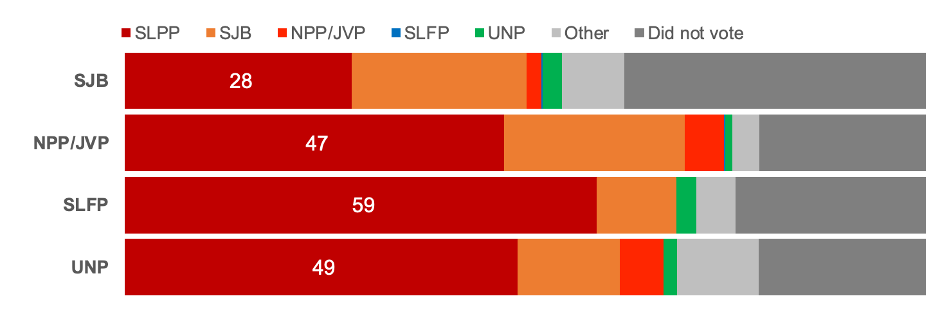 |
| Institute for Health Policy Sri Lanka Opinion Tracker Survey MRP
Based on 724 interviews conducted in Jan. 2023. Analysis using MRP (IHP Model G), with margin of error for shares assessed as 3–5%. |
This degree of switching between consecutive elections is probably unprecedented in Sri Lankan electoral history. If this translates to the upcoming local authority elections, this will see an exceptional performance by the JVP, which is the main constituent of the NPP. The NPP/JVP continues to be the main beneficiary of the economic and political crisis and the main beneficiary of the collapse in the SLPP support. Nevertheless, the electorate remains highly divided with no one or two parties emerging as the clear choice of the public. This suggests that the electorate remains unsure who to vote for and correspondingly that no political party has succeeded in capturing the imagination of the long suffering Sri Lankan people.
How IHP estimates voting intention
IHP’s voting intention estimates use polling data from the Sri Lanka Opinion Tracker Survey (SLOTS), which is a national phone survey that has been tracking public opinion every day since August 2021, interviewing people across the country. Respondents are drawn from a mixed sample of a national representative panel of respondents previously recruited in 2019 through face-to-face interviews from all parts of the country, and others reached by randomly dialling mobile numbers.
SLOTS asks respondents who they voted for in the 2019 and 2020 elections, and who they intend to vote for in a future presidential and general election. To minimize bias, the order in which voting choices are presented is randomized between respondents. For much of the survey period, a major challenge in the SLOTS polling compared with other countries is that many respondents refuse to answer these questions, especially current voting intentions, with those who do respond more likely to be SLPP supporters. This has also changed over time, with the rate of refusals declining after the collapse of the government in mid-2022.
To analyse SLOTS data, IHP currently uses two alternative strategies. The first (Model A) simply smooths the monthly voting data by pooling each month with interview responses from the previous and following weeks, using iterative proportional fitting to match each monthly sample to the national population according to demographic characteristics and past election results. Previous SLOTS reports have reported results from this model.
The estimates given here are from the second strategy, which is an adaptation of Multilevel Regression and Post-Stratification (MRP). IHP uses MRP to overcome the relatively small number of interviews in each month (N=400–1,000) which leads to a lot of noise in Model A estimates. Pollsters in other countries have increasingly used MRP in recent years to leverage small polling samples to track voting intention and predict detailed election results. Its most notable uses have been by YouGov in predicting the Brexit referendum and 2017 and 2019 elections in the United Kingdom, where MRP performed more robustly than traditional polling methods.
IHP currently runs three MRP models (F, G and M). All three use the same large data file (~100,000 observations) that mimics the national electorate at national, provincial, and district levels. To compile this data file, the past voting behaviour of SLOTS respondents who did not answer these questions is first modelled probabilistically using all interview responses since August 2021, with the current models using 10 draws from the estimated distribution. This modelling step uses a range of data on respondent background characteristics collected by SLOTS, including underlying human values, as well as information from a Heckman selection model of respondent response. The resulting data file with multiply imputed past voting behaviour is then weighted to match the national population along multiple dimensions, including age, sex, ethnicity, religion, education, socioeconomic status, geographical location, sector, and the 2019 and 2020 election results.
In a second step, the relationship between respondent background characteristics and current voting intention is modelled for each month using information from all survey months. The respondent background characteristics considered include past voting behaviour. Model M uses a multilevel modelling framework as in the original MRP method, whilst models F and G use penalized regression, which is mathematically similar. Although these are statistically equivalent, the second approach requires less computation resources.
The relationships obtained in the second step are then used to predict current voting intentions across the full electorate simulated by the national data file generated in the first step (Models F, G and M). This third step yields estimates that are more robust and more finely detailed than would be possible if only the interviews for say a given month were used.
Model F is a registered voter model that estimates how people will vote if everyone votes, and Model G is a likely voter model that adjusts for whether people will vote. Model G adjusts the Model F results using a likely voter model to adjust for turnout, exploiting interview data on whether respondents said they would vote or not. This last step assumes that election turnout would be 75%, as in the 2020 General Elections.
IHP is not currently releasing estimates from Model M. This model requires substantially more computation resources, and current estimates from this model are not stable enough to share publicly.
IHP’s estimates come with some uncertainty, due to the sample data collection (typically 500–1,000 interviews each month), the estimation methods used, and the various assumptions made. For example, some respondents who currently say they will vote for other parties may vote on the day for one of the major parties making our predictions under-estimates. Additionally, if voter turnout is higher than we assume, this will increase the NPP/JVP share over the SJB, and visa-versa. Because of the complexity of the methods used to generate these estimates, IHP is not currently calculating margins of error. However, each major party’s share of vote intentions in January 2023 is likely to be associated with a margin of error of 2–3%, whilst estimates for the April–October 2022 period are associated with a larger margin of error (3–5%) owing to smaller monthly interview samples.
The author thanks his many colleagues at IHP who contributed to the design, management and implementation of the SLOTS survey and related data analyses. IHP is also grateful to the funders who have supported the SLOTS effort who include the Neelan Tiruchelvam Trust, the UK National Institute for Health and Care Research (NIHR), the Asia Foundation and others.