
Photo courtesy of Sky News
Scrolling through newsfeeds I find at least one article that refers to the number of people who are starving every day in Sri Lanka. My friends who are teachers say that children’s lunch boxes contain less variety. A principal reported that children are “fainting at their morning assembly”. As the economic crisis continues, such incidents and the number of people at risk keep rising.
Before the economic crisis, the Household Income and Expenditure Survey (2019) by the Department of Census and Statistics (DCS) shows that 9% of the total population were affected by food insecurity. In 2022 a household survey by the World Food Program indicates that 37% of people are food insecure (WFP, 2022). This is a significant proportion of Sri Lankans and is also indicative of the worsening conditions. However, discussion on the issue borders on being apathetic in political and media discourses. But what can be done to heed the warning signs and take action?
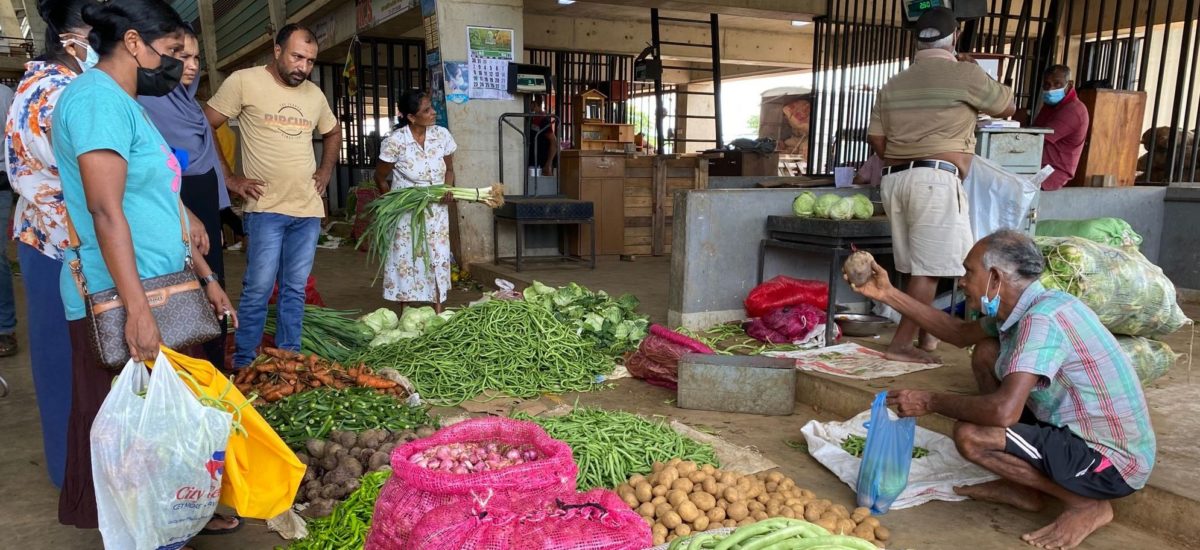
In June to July this year World Vision, ACTED and the Centre for Poverty Analysis (CEPA) collaborated on a rapid assessment covering 4000+ households across the island (in all provinces except Sabaragamuwa) to gauge the severity of the problem and to strategize for interventions. In this survey nearly 80% of the respondents were from the four lowest income deciles (households with an income of less than Rs. 45,000 per month) and 77% of them resided in rural areas.
Who is feeling the pressure?
In order to identify who is food insecure, a Food Consumption Score (FCS) was developed using WFP guidelines. An FCS classifies households as poor, baseline or adequate based on dietary diversity, food frequency and the relative nutritional importance of food groups to understand if household members are consuming balanced and nutritious diets[1].
The survey reveals 22% of the respondents have either poor or borderline FCS meaning that they are facing difficulties meeting their food needs. There tends to be variation in food consumption across geographical areas as well. 36% Western, Southern and Central provinces have a poor FCS while in the Southern province, 30% have borderline FCS and more than 15% in Central, North Central, Uva and Western provinces have borderline FCS. What the survey also reveals is that these households that are food insecure are not just from the lowest income decile but are also spread across the next three tiers of income deciles. This indicates that food insecurity is affecting more developed provinces such as Western Province and that there are increased levels of vulnerability.
Percentage of the respondents with either poor or borderline FCS
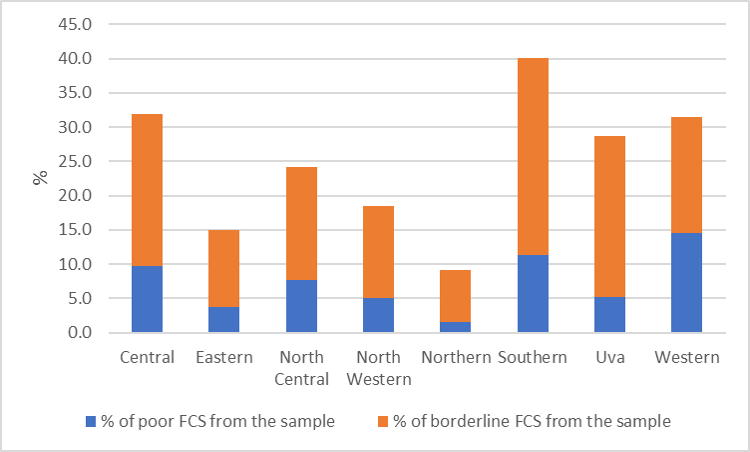
Source: World Vision/ACTED/CEPA Survey (2022)
Digging deeper, the data shows that 36% of households employed in unskilled agricultural labor have either poor or borderline FCS. There are a few other occupations (such as informal/small traders and street vendors) that also have 15% or more respondents who are food insecure. Moreover, 29% of households getting Samurdhi or other government benefits also have poor FCS and are in the lowest income deciles. These percentages reveal that certain occupations are more vulnerable and also that social safety nets are not able cover food needs.
How are people coping?
The coping mechanisms reveal the seriousness of the problem. It is a warning of things to come. Of those who have a poor FCS, 62% skip meals and 67% worry about not having sufficient food for the household. Furthermore, 59% of those with poor FCS have switched to less preferred food for more than three days while nearly 54% have limited their food portion and nearly 70% have reduced the number of meals at least for one day. Those that have borderline FCS are also employing similar coping mechanisms to a lesser extent.
How households with poor FCS were coping with the rise of food prices
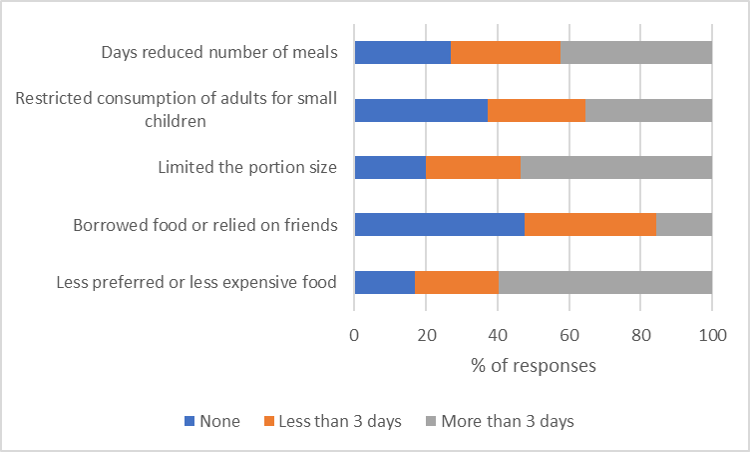
Source: World Vision/ACTED/CEPA Survey (2022)
Other coping measures include selling assets and using savings to access food. While not so severe among those with borderline FCS, on average, nearly 49% of the respondents with a poor FCS have exhausted these options indicating that they are at the brink of not being able to afford food in the coming months.
So, the survey reveals that six out of every 100 people and 17 out of every 100 people in the survey are either poor or borderline with respect to food consumption. The survey also shows that around 25% of the surveyed are vulnerable, this proportion might be much larger within the entire population.
What can be done?
Respondents’ opinions on the assistance they require
| Poor FCS (%) | Borderline FCS (%) | ||
| Cash assistance | 76.8 | Cash assistance | 59.3 |
| Inputs for agriculture | 30.39 | Inputs for agriculture | 44.4 |
| Other | 14.3 | Other | 18.9 |
| Inputs for livestock | 11.05 | Inputs for livestock | 14.8 |
| Access to tractors | 9.94 | Support for processing product | 10.11 |
| Marketing Support | 9.9 | Loans | 9.2 |
| Loans | 9.9 | Access to land | 7.4 |
| n (Frequency) | 238 | n (Frequency) | 683 |
Source: World Vision/ACTED/ CEPA Survey (2022)
As the survey reveals, assistance given to these communities needs to be customized. While the majority of those who had a poor FCS agreed that cash assistance is what is needed for them to survive (76.8%). Only 59% of those who have a borderline FCS mentions that they need cash assistance. The issue that needs to be understood here is that the focus for survival for these two types of households are quite different. The poor FCS group needs direct cash assistance more to make sure that their households are fed; the borderline FCS group require inputs and financial support to make sure their primary occupation survives these economic conditions. Furthermore, under constrained economic conditions it highlights the need for more coordinated and comprehensive policies and programmes that address access, availability, and affordability of adequate and nutritious food.
[1] USAID 2020, FFP Indicators Handbook, Part III Indicators for Emergency Activities January 2020
This article can also be accessed at https://www.cepa.lk/blog/warning-signs-recognising-who-is-at-risk-how-they-are-coping-and-taking-action/
Disclaimer: The views expressed in this article are those of the author and do not necessarily reflect the views and policies of CEPA, ACTED or World Vision.