Photo courtesy of Daily Mirror
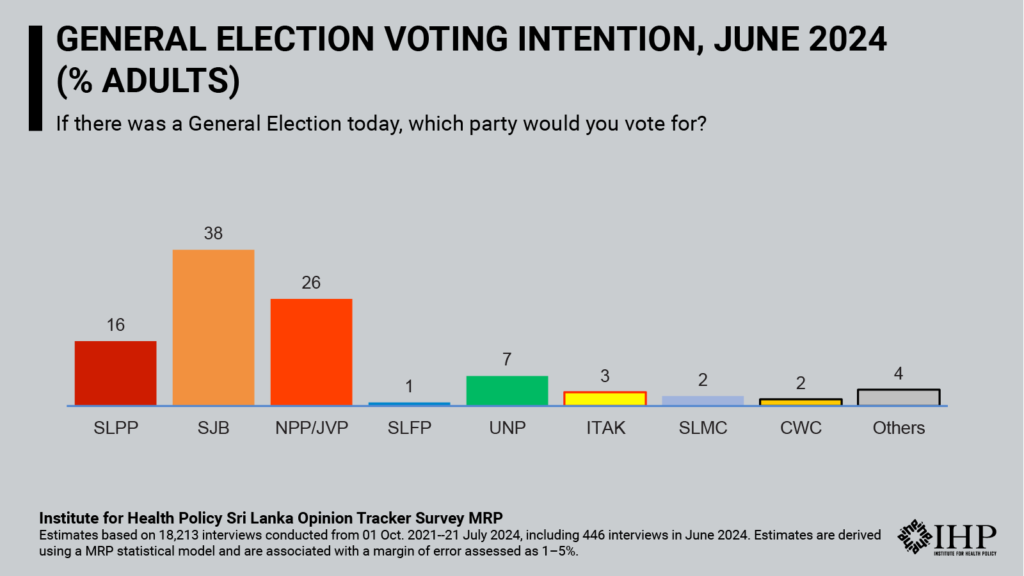
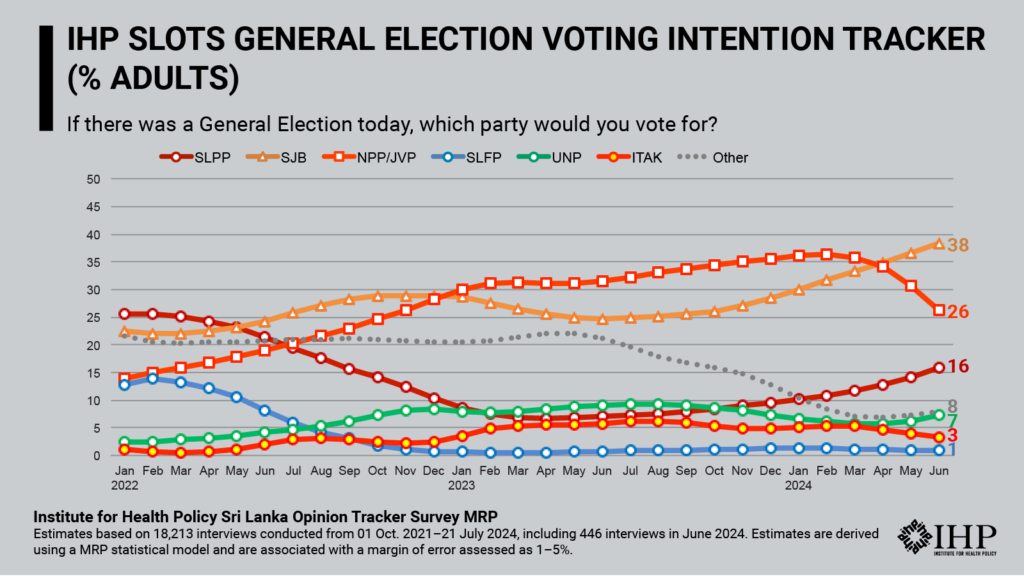
The latest estimates from Institute for Health Policy’s (IHP) SLOTS MRP model show a decline in all adult voters’ support for NPP/JVP to 26% (-5 compared to the previous month) pushing SJB ahead in June. SJB leads with 38% (+1) support followed by NPP/JVP with SLPP at 16% (+2), UNP at 7% (+1) and ITAK at 3% (-1). The June estimates are provisional and are associated with a margin of error of 4-5% for the two leading parties.


Compared to IHP’s June release, estimates of NPP/JVP and SJB support in May 2024 were revised -3 and +3 points respectively. However, the margin of error increased substantially in the June estimates, so IHP advises caution in interpreting recent trends.
These estimates are for all adults and not for likely voters. They are based on the January 2024 revision of the IHP SLOTS Multilevel Regression and Poststratification (MRP) model. IHP is working on improving its likely voter model and will resume the release of voting intent in likely voters in a future update. It should be noted that differences in voting intent shares between all adults and likely voters have typically been 1-2% for most estimates in the past two years.
This June update is based on 18,213 interviews conducted with adults across Sri Lanka since October 2021 including 446 interviews carried out in June 2024. IHP’s SLOTS MRP methodology first estimates the relationship between a wide variety of characteristics about respondents and their opinions, in this case, “If there was a General Election today, which party would you vote for?” in a multilevel statistical model.
SLOTS combines interviews from a national sample of adults (ages 18 and over) reached by random digit dialling of mobile numbers and others coming from a national panel of respondents who were previously recruited through random selection and face to face interviews.
The June 2024 MRP estimates are based on 18,213 interviews conducted from October 1, 2021 to July 21, 2024 including 446 interviews conducted in June 2024.
All estimates are adjusted to ensure the sample matches the national population with respect to age, sex, ethnicity, socioeconomic status, education, geographical location and voting in the 2019 presidential and 2020 general elections.

