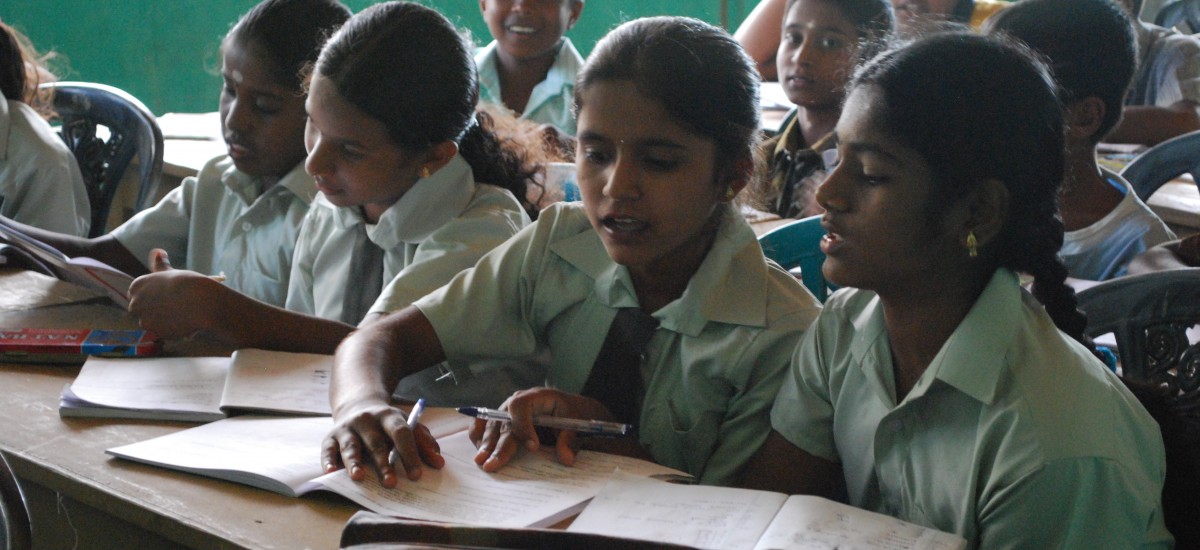
Image courtesy Rose Sri Lanka
Sri Lanka’s Free Education Scheme aims to provide each child an equal opportunity at educational success, but there is debate over to what extent it succeeds in this endeavor. Notably, some critics are concerned that private spending on education (for private and international schools, universities, and tuition) may be diluting the Free Education Scheme’s ability to provide equal opportunities to all. My doctoral dissertation is composed of three studies exploring these issues. This article summarizes the first of the three studies.
Educational stratification in Sri Lanka
Sri Lanka’s Free Education Scheme has been a source of national pride for decades. Compared to other developing nations, Sri Lanka provided broader access to education very soon after independence. For most Sri Lankans, the Free Education Scheme does not simply mean there are no school tuition fees charged, but also that any child can succeed academically, regardless of their background. Echoing this sentiment in a speech given on 8 November, 2013, Gotabhaya Rajapakse claimed: “As a result of the long-established system of free education and the importance placed on education by parents, children in Sri Lanka have equal opportunity to gain an education, irrespective of their social backgrounds and their gender.”[i] Sri Lanka’s successes in this regard are impressive: while neighboring countries continue to struggle to provide universal primary education, Sri Lanka nears universal participation through the Ordinary Level (O/L) exam in Year 11.
However, concerns about the quality of education provided, increasing competition in entrance exams for prestigious schools, and the expansion of private tuition as a supplement to public education raise questions of equity. Further, government claims of educational equity are difficult to assess empirically, as the Ministry of Education does not publish data on how enrollment, completion and academic performance vary with key social variables, such as socio-economic status (SES) or ethnicity. As in many developing nations that have achieved universal primary enrollment, questions about student learning and equity remain: To what degree does the Free Education Scheme ensure equal access to educational opportunities? By contrast, to what degree can background characteristics be seen as determinants of children’s achievement? Are these factors more important at certain points in children’s educational careers than others? Are these relationships stable, or are they changing over time? I explore these questions in my analysis below.
Kinds of Stratification
Sri Lanka’s primary and secondary education system can be conceived of as a series of milestones that children may make successfully, or may drop out of school:
| · Entering Year 1· Finishing Year 5
· Finishing Year 9 |
· Passing O/L· Passing A/L
|
If it were true that “children in Sri Lanka have equal opportunity to gain an education, irrespective of their social backgrounds and their gender” background characteristics would have not statistically significant associations with successfully completing these milestones. My analysis will test whether or not such associations exist with a number of social variables, each of which I discuss in some detail below.
2.1 Socio-Economic Status
There is a large body of sociological research that sees education as an institution with a dual nature: it allows certain individuals to be upwardly mobile while helping to reproduce socio-economic status (SES) in most families from generation to generation. In the Sri Lankan public discourse today there is a strong public debate about the extent to which the educational system provides opportunities for social mobility. There is a substantial amount of research on the association between socioeconomic characteristics and educational outcomes,[ii] but public discourse does not draw on the statistics provided in such research to quantify stratification or to attempt to describe time trends. The Sri Lankan government and government-associated media either claim the goal of equal opportunity for all is currently realized or they project the goal is soon to be accomplished, through a variety of programs intended to provide equal access to educational opportunities. However, scholars of education and leftist political groups suggest the quality of instruction in government schools has declined, particularly in schools serving disadvantaged communities.
2.2 Ethnicity
Indicators for ethnicity are widely used in education and stratification research because in many countries there are strong relationships between these categories and educational outcomes. This can be because of differences in the resources and programming at schools that serve different groups, because differences in cultural norms by ethnic community may lead to different attitudes towards education, or for other reasons.
In the Sri Lankan context, the historical development of the school system suggests several hypotheses about ethnic and religious differences in educational outcomes.[iii] The British colonial powers particularly cultivated elite boys from the Burgher and Tamil community for advancement through education into state service careers, while Sinhala elites typically remained land owners and Muslim elites worked in primarily in commerce. Out of this history emerged a stereotype that remains widespread in Sri Lanka today, which assumes Tamils students are the most successful, then Sinhalese, then Muslims and Up Country Tamils. Comparisons between the composition of university entrants and the population in 1950 largely confirm this view.[iv] However, since independence the two most important political parties have vied to outdo each other in providing services, especially education, to the majority ethnic Sinhalese. As a result, much of these differences had diminished and reversed in the three decades after independence, with Sinhalese more likely than all other groups to enter state service careers and most university faculties.[v]
2.3 Urbanicity
In international comparative studies, gaps favoring urban over rural students in enrollment rates and educational attainment exist in almost all developing countries. However, the historical development of the education system in Sri Lanka suggests the international trend of higher educational attainment in urban areas may not hold in Sri Lanka. Post-independence political parties courted the rural vote by investing in schools and other development projects heavily through the 1950s and 1960s. Not only were village primary schools constructed and staffed, but also “central schools” that offered quality secondary education in rural areas. Rural schools are widely considered to provide lower quality education than urban schools, and while some empirical evidence supports this argument, once other socio-economic factors are controlled for urban and rural schools may not be very different.
Another particularity of Sri Lanka is the existence of the estate sector, in addition to the urban and rural sectors. As opposed to urban and rural areas, estate area schools did not initially receive strong government investments in the early years of independence. The organization of estate schools was given over to the tea companies with few requirements from the government, and although the Ministry of Education formally took over estate schools in 1966 and gradually became more involved over the 1980s and 1990s, in popular perception the estate sector continues to lag behind the other two.
2.4 Sex
Recent global studies of educational achievement by sex have show that the gap favoring boys over girls has been closed in most developing countries, and typically reversed in middle-income countries such as Sri Lanka. Further, Sri Lanka has a history of early successes closing the sex gap.
3 Data and Methods
To examine what kinds of educational stratification exist in Sri Lanka, I use data from two surveys by Sri Lanka Department of Census and Statistics.[vi] I use logistic regression to model the relationship between background characteristics and success at educational milestones, following Robert Mare’s methodology,[vii] then I proceed to examine time trends in how stratification developed from 1985 to 2010.
4 Results
4.1 Stratification Patterns
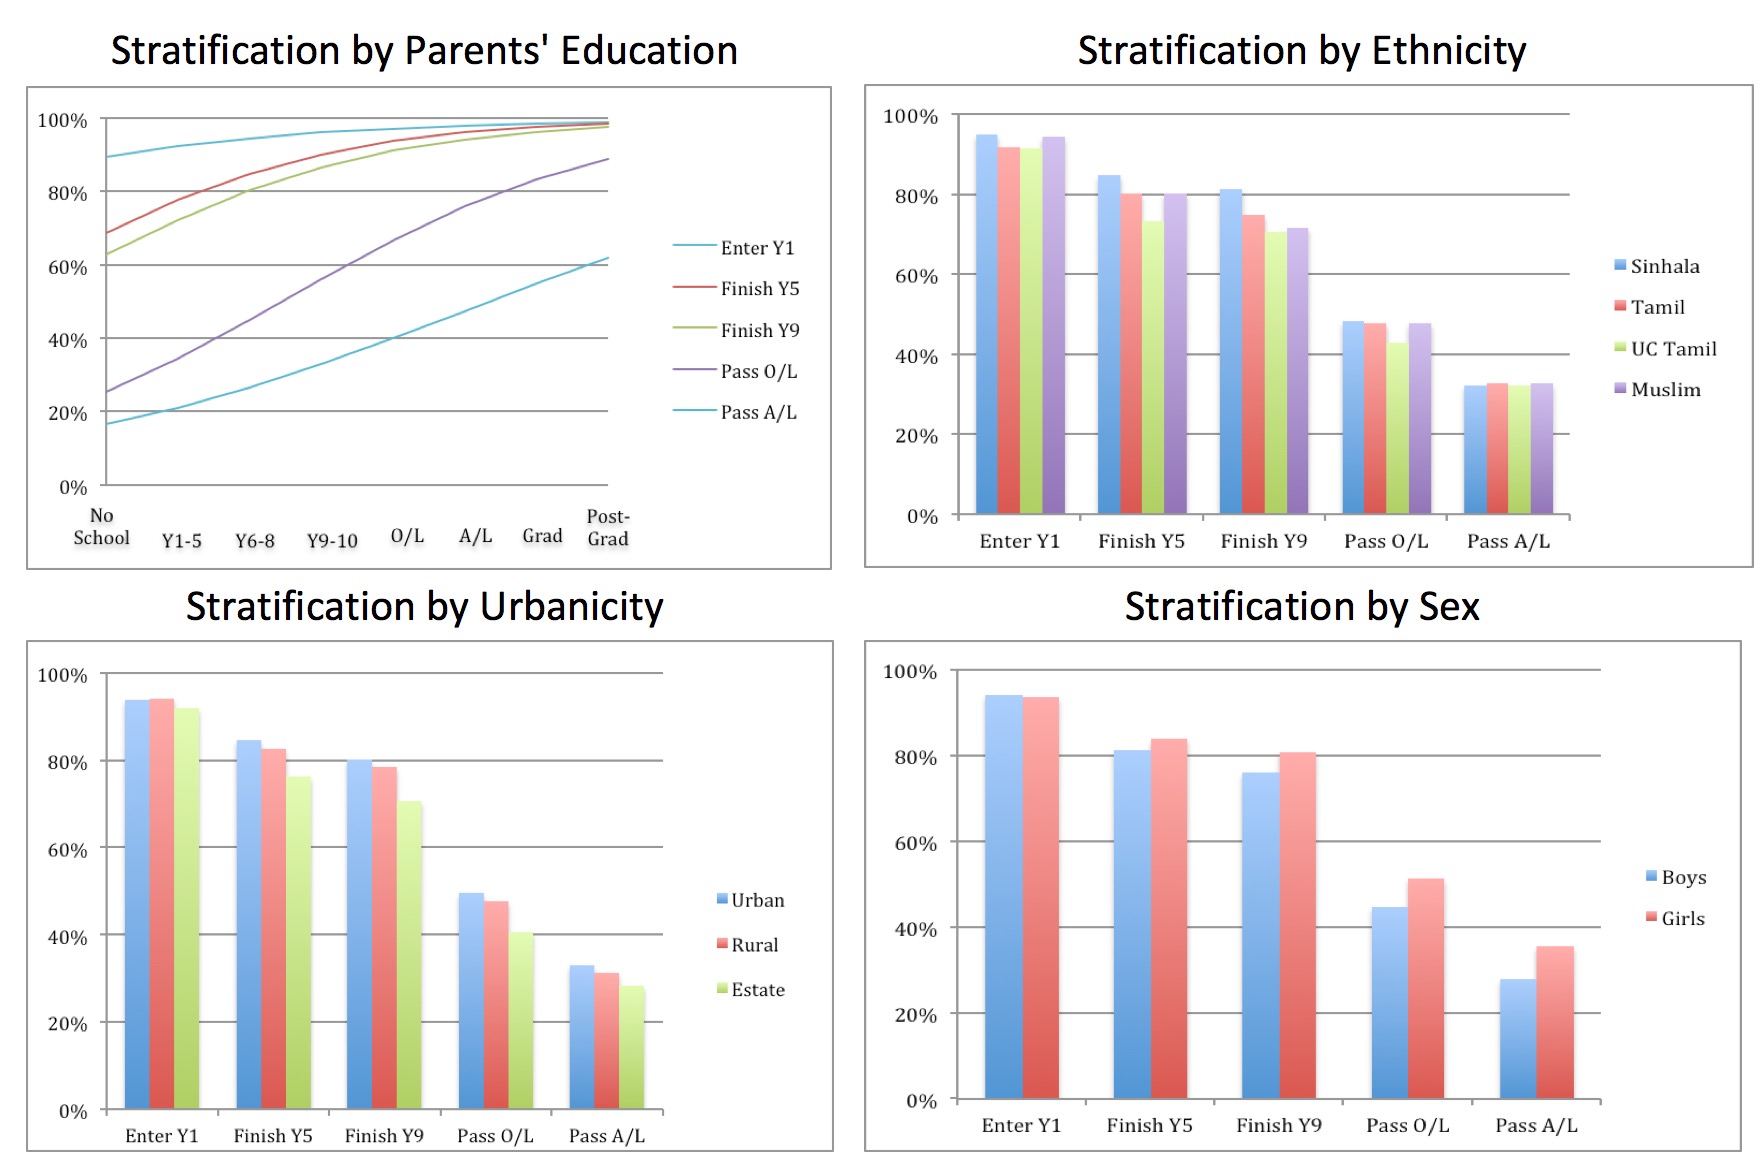
My analysis shows that the following groups are more likely than their counterparts to successfully pass educational milestones and not drop out of school: high SES children, Sinhala children, urban children, and girls. The following charts show the predicted probability of passing milestones for different groups, after controlling for all other variables. These charts give a sense of how strong stratification is by each characteristic, and whether stratification patterns change as children advance from primary through secondary school.
I will highlight some of the most important patterns I see in the above charts. First, stratification by SES is much stronger than the other kinds of stratification, particularly at the O/L and A/L; differences between groups are much less dramatic when considering ethnicity, urbanicity, and sex. Second, Tamils do not have the best education outcomes, contrary to the prevalent stereotype. In fact for entering Year 1 and finishing Years 5 and 9, the predicted probabilities of three minority communities are lower than for Sinhala children. Third, differences between urban and rural are relatively small, countering the common assumption that urban schools are of higher quality than rural schools. Finally, the gap between girls and boys grows from Year 1 through A/L, painting a concerning picture of boys increasingly disaffected with academic achievement.
4.2 Time Trends
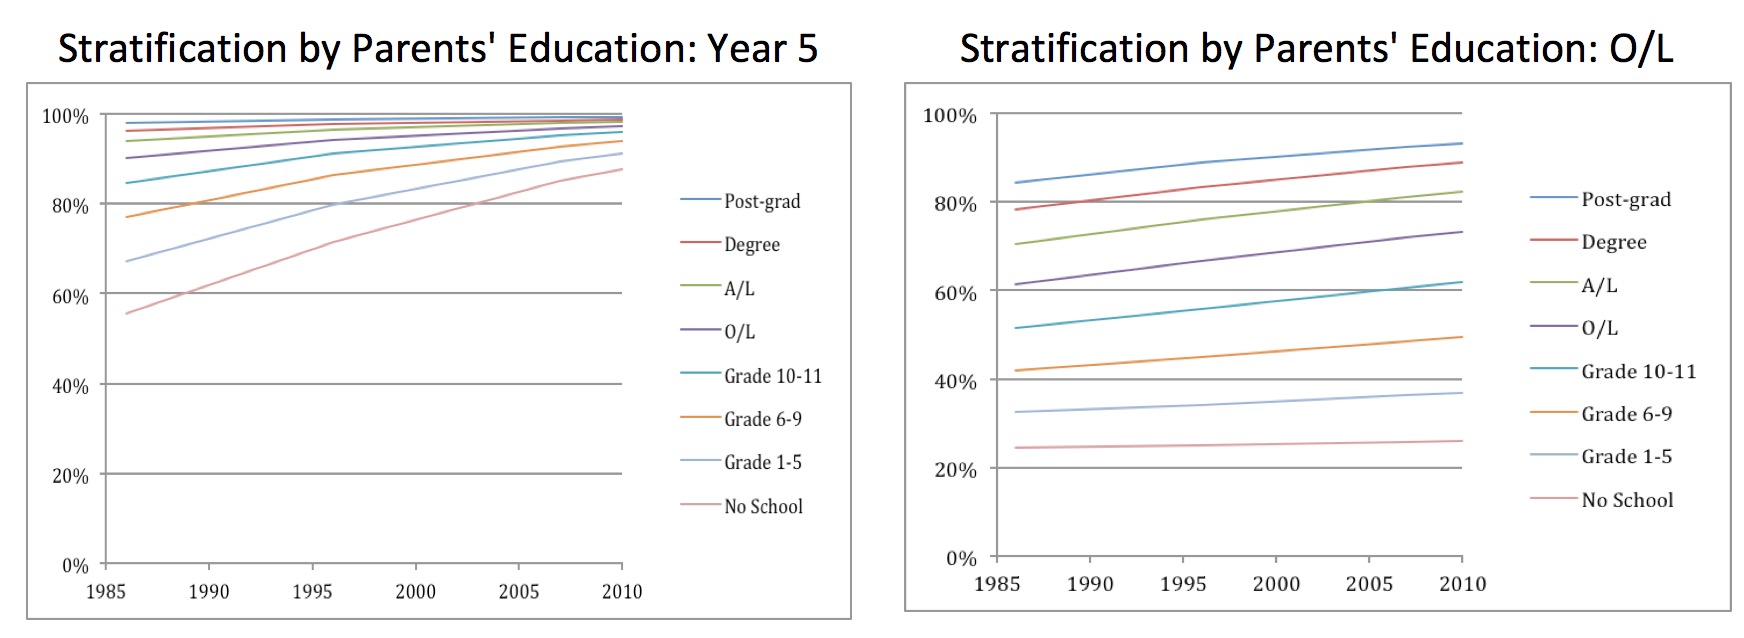
Analysis of time trends by SES showed different patterns for finishing Year 5 and passing O/L:
The chart for Year 5 shows that, while in 1986 there was a large difference in the likelihood of finishing Year 5 for a child of uneducated parents and a child of parents with post-graduate education, by 2010 this difference had shrunk considerably. This finding could be considered a victory for the Free Education Scheme. However, to be promoted from Year 5 to Year 6 students do not have to demonstrate their academic competence. This chart shows that increasingly both high and low SES children continued to be enrolled in school through the upper primary grades, but it doesn’t show how much children in two groups learned. By contrast, passing the O/L exam requires learning. The chart for O/L shows that stratification by SES became stronger from 1986 to 2010 at this level, because the gap between high and low SES children grew over time. This finding is concerning for proponents of Free Education, and raises questions about whether the weakening stratification at Year 5 has substantive positive impacts on low SES children’s lives.
Similarly, there are concerning time trends for ethnicity and sex. At Year 1 and Year 9, the predicted probabilities of success rose faster for Sinhala children than for Tamil children, and at A/L the predicted probabilities rose faster for Sinhala children than for Muslim children. At O/L, the predicted probabilities of success rose faster for girls than for boys. In all these cases, growth rates were faster for the group that had higher outcomes in 1986, so the advantages enjoyed by Sinhala children and girls grew even greater over by 2010.
4.3 International comparisons
However striking these differences are to supporters of Sri Lanka’s Free Education Scheme, international comparisons provide some helpful context for these results. Associations between social background variables and transition success are similar or weaker in Sri Lanka than in many other contexts, so the odds of a child from a socially disadvantaged background being educationally successful in Sri Lanka are better than in many other countries. Associations are weaker with parents’ educational attainment, ethnicity, urbanicity, and student sex. While the equity goal of the Free Education Scheme may not be completely realized, these comparisons suggest that Sri Lanka’s education system is closer to achieving that goal than many other countries.
Conclusions
This study contradicts extreme opinions on either side of the Free Education debate: education is neither entirely free nor solely the preserve of the powerful. There are differences in outcomes along socio-economic, ethnic, urbanicity, and sex lines, but these differences are smaller than those found in many other countries. Several time trends I identified raise concerns, as stratification appears to be growing. My results identify areas of particularly acute inequalities where policy makers and advocates can focus their attention. Initiatives aimed at monitoring and improving outcomes for low-SES students, ethnic minorities (particularly at the primary level), and boys should be high priorities for further reducing inequalities. Further, attention should be paid not only to enrollment, but also to exam performance and other measures of student learning and development.
An important priority for future research is to conduct a similar analysis with data from the entire country, including the most war-affected districts in the North and the East, as the data I used did not include these areas after 1985-86. Given the sustained disruption caused by the ethnic conflict, a better understanding of its impact on these parts of Sri Lanka could identify areas where the education system needs further support and could help reconciliation processes island-wide. More broadly, continued monitoring of educational stratification in Sri Lanka and other developing countries is important. The debate on educational equity in Sri Lanka is contentious and has spurred social strife in the past, so it is advisable to ground this national conversation in empirical description of the facts on the ground.
Rachel Cole is a doctoral candidate in International Education at New York University. Her doctoral dissertation is composed of three quantitative studies exploring educational equity in Sri Lanka. She may be contacted at [email protected].
[i] See Rajapakse, G. (2013). Private And International Schools Can Be More Responsive To Change Than Govt Schools. Colombo Telegraph, November 9, 2013. Retrieved from https://www.colombotelegraph.com/index.php/private-and-international-schools-can-be-more-responsive-to-change-than-govt-schools/.
[ii] See: Strauss, M.A. (1951). Family Characteristics and Occupational Choice of University Entrants as Clues to the Social Structure of Ceylon. University of Ceylon Review, 9, 125-125.
Uswatte-Aratchi, G. (1974). University Admissions in Ceylon: Their Economic and Social Background and Employment Expectations. Modern Asian Studies, 8, 289-318.
Niles, F.S. (1981). Social Class and Academic Achievement: A Third World Reinterpretation. Comparative Education Review, 25, 419-430.
Rupasinghe, S. (1985). Factors associated with high and low achievement at the grade five examination for scholarships and entry into schools. University of Colombo.
Aturupane, H., & Deolalikar, A.B. (2011). Evolving Inequality of School Attainment in Sri Lanka. Report No 44, South Asia: Human Development Sector, World Bank Discussion Paper Series, August 2011.
[iii] The HIES and LFSES surveys used in this study allowed respondents to chose from the following ethnic categories: Sinhala, Sri Lankan Tamil, Indian Tamil, Sri Lankan Moor, Malay, Burgher, and Other. I use the terms “Tamils” and “Upcountry Tamils” for the two Tamil groups, and the term “Muslims” for “Sri Lankan Moors” and “Malays.”
[iv] Strauss, M.A. (1951). Family Characteristics and Occupational Choice of University Entrants as Clues to the Social Structure of Ceylon. University of Ceylon Review, 9, 125-125.
[v] See Uswatte-Aratchi, G. (1974). University Admissions in Ceylon: Their Economic and Social Background and Employment Expectations. Modern Asian Studies, 8, 289-318.
Committee for Rational Development (1984). Sri Lanka: myths and realities. Race & Class, 26, 139-157.
[vi] HIES, 1995-96, 2006-07, and 2009-10 waves, and LFSES, 1985-86 wave. While the LFSES survey collected data in all districts of Sri Lanka, for all three waves of the HIES surveys the districts of the Northern and Eastern provinces were either not included or were sampled on a shorter timeline because these areas were most directly impacted by the conflict. This study’s findings cannot be considered representative of all of Sri Lanka, but rather only the portions sampled. This incomplete coverage is likely to have important impacts on my findings for ethnicity, as large portions of the Tamil community and substantial portions of the Muslim community live in these districts.
[vii] Mare, R. D. (1980). Social background and school continuation decisions. Journal of the American Statistical Association, 75, 295-305.


