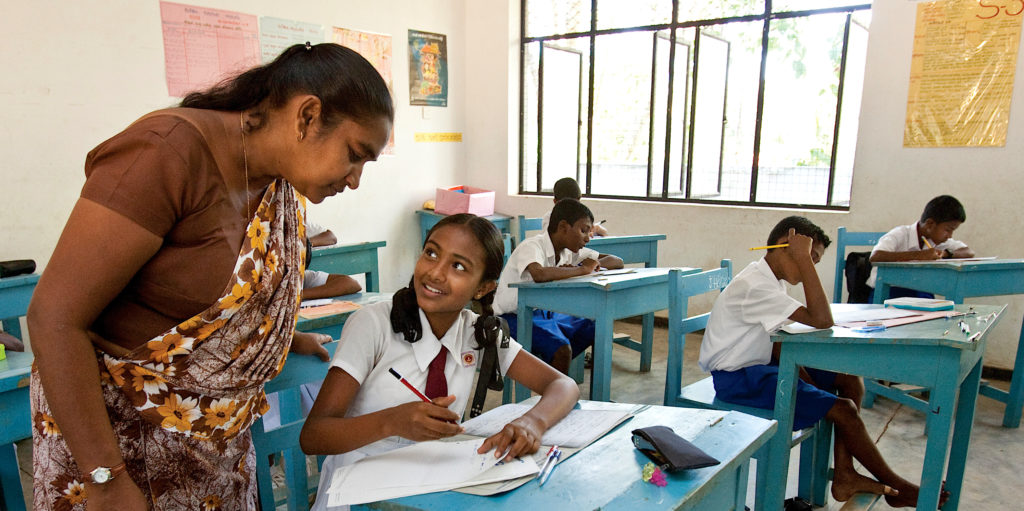
Photo courtesy of The Borgen Project
As Sri Lankans head to the polls, most voters want the government to increase spending on health and education according to the latest findings from the Sri Lanka Opinion Tracker Survey (SLOTS).
Since September 2022, as the economic crisis forced the government to rethink budget priorities, SLOTS has regularly asked survey respondents to identify their top two priorities for increasing government spending and their top two priorities for cutting government spending.
During 2024, the top priorities for increased government spending have consistently been health (78%) and education (64%). These were also the only areas where spending increases were supported by majorities of Sri Lankans with support cutting across all demographics. Agriculture was the next highest priority for increased spending (33%) followed by food assistance (9%), housing (4%) and Samurdhi/Aswesuma (3%).
SLOTS respondents have been more reluctant to identify priorities for cutting spending and only one spending category obtained majority support for spending reductions, which was housing at 51%. When asked what they would prioritize for spending cuts if government lacks funds, the highest ranked items were housing (51%) and food assistance (44%), followed by Samurdhi/Aswesuma (22%), the police (14%), roads (13%) and the military (12%).
Support for increasing government spending on health and education was widespread and cut across all demographics. Both poor and better off rank health (71% vs. 79%) as their top priority for increased spending. The better off were more likely to prioritize education (70% vs. 53%) but both the poor and the rich agreed on the need to increase spending in these two areas. There were few differences on this by age but the youth (18–29 years) were more likely to prioritize education spending compared to older adults (60+).
There were clear differences by income level in how people viewed food assistance and Samurdhi/Aswesuma. Increasing spending on food assistance was a higher priority for poor Sri Lankans (17%) than for the better off (5%). Similarly, one fourth of the poor (29%) prioritized it for reductions in spending while half of the better off (49%) support reduced spending. There were similar preferences over Samurdhi/Aswesuma with the poor much more likely to prioritize it for increases in spending and the better off much more likely to prioritize it for spending cuts.
There was no support for prioritizing the army or the police for spending increases and one in eight prioritize either for reducing spending. However, poor people were more likely to cite the army or police as a priority for cutting spending.
There are notable differences in spending priorities among different ethnic groups. Sinhala adults are more likely than other ethnic groups to prioritize health (82%) and education (66%). Meanwhile, Estate/Indian Tamil and Muslim adults tend to prioritize food assistance (Estate 32%, Muslim 27%) and housing (Estate 22%, Muslim 22%) than others.
Although health and education have consistently remained the top two spending priorities, the percentage of people prioritizing increased spending on health has steadily increased from 58% in 2023Q1, reaching 87% in 2024Q3. This may reflect the worsening impact of shortages of medicines and staffing in the government health sector, combined with the increasing difficulties most people face in paying for private health care as real incomes have fallen. Meanwhile, support for spending increases on agriculture has declined.
SLOTS combines data from a national sample of adults (ages 18 and over) reached by random digit dialling of mobile numbers and others coming from a national panel of respondents who were previously recruited through random selection. All estimates are weighted to be representative of the national population, including characteristics such as age, gender, province, sector, socioeconomic status, ethnicity and education.
SLOTS interviews representative samples of adults every day by telephone to gather their current views and situation. All interviews include a core set of common questions with additional rotating sets of other questions that examine issues of topical importance. Interviews are done daily by phone by IHP employees with respondents recruited by a national field survey or by randomly dialling mobile phone numbers.
SLOTS respondents consist of a mix of respondents reached by random digit dialling of mobile numbers and others coming from a national panel of respondents who have agreed to be re-interviewed and who were previously recruited using random selection.
