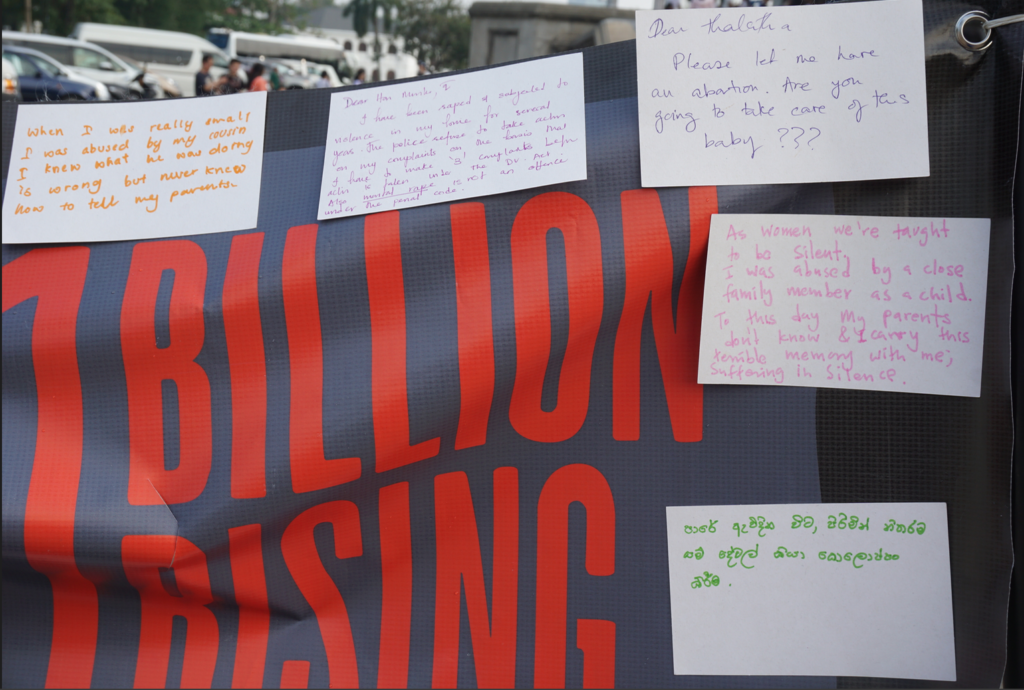
In 2016, Groundviews mapped incidents of street harassment for International Women’s Day. None of these incidents had been reported to the police.
Those who contributed their stories to the map recounted experiences that remained painful or frightening, even years later.
This year, Groundviews wanted to ascertain the disparity between public experiences on street harassment and available police statistics. The grave crimes abstract that is publicly available on the police website does have statistics on rape, statutory rape and grave sexual abuse, but not on street harassment. Groundviews filed Information requests both with the tourist police and the Police Headquarters in order to ascertain what statistics were available on street harassment for the previous year. Our suspicion was that the police did not record statistics for street harassment. This proved to be partially correct.
Click here to view this map more clearly.
The map above records available police statistics on sexual abuse. 2312 incidents of sexual abuse which were reported in 2018, while there were 17 incidents of sexual abuse reported by tourists.
Both the tourist police and the Women and Children’s Bureau requested that Groundviews inspect police logs, because providing the information would be logistically impossible. In order to receive the information, the Officers-In-Charge at both places had to comb through an entire year’s worth of handwritten records. Their task would have been swifter and easier if the log-books had been digitised. It appeared that the only nod to the 21st century was the grave crimes abstract itself, which is in PDF format and not easily searchable. Nor does the grave crimes abstract contain any explanation of what the categories mean – for instance, what qualifies as sexual abuse.
Interestingly, the way the data was compiled was different. The Women and Children’s Bureau at the Police Headquarters, for instance, was entirely unable to provide statistics for street harassment – as they explained, this fell under the broad category of sexual abuse. The Headquarters had a separate book with the total number of sexual abuse cases reported for 2018, and this was what Groundviews received –the officer noted that it was not possible to receive details around each incident reported.
On the other hand, the tourist police headquarters maintained their own log-books, allowing them to provide a detailed incident-by-incident breakdown. This included cases of street harassment, flashing, assault and rape. The Officer in Charge at the tourist police noted that tourists did not frequently complain of harassment – there were far more complaints of theft.
And yet, research shows that street harassment is common, and not just for tourists. A UNFPA study conducted in 2015 found 90% of women surveyed had experienced street harassment on public transport. 74% of these incidents were physical in nature and included unwanted touching.
Those who do report or come forward to talk about street harassment are often targeted themselves. For instance, a tweet from management executive Malki Opatha on her experience of street harassment had many people asking her why she had chosen to sit near the window on the bus. Others had told her that she should have shouted at the perpetrator. In response, Malki felt the need to shoot a video explaining why she had not reacted to the person who harassed her.
“We don’t react because we’re not ready. Even if we have awareness about harassment on public transport, we don’t know how to react. We go numb. Our body freezes. Even if we want to shout, sometimes we can’t,” Malki explains in the video.
A recent UNPFA campaign on street harassment to mark 16 days of gender-based violence saw many commenters blaming those who came forward to share their stories of street harassment.
“With your make-up he may [have] thought you were someone. I don’t like [those] who are putting on too much make-up. And another thing, why should he [harass] you? there aren’t any girls in bus except you??” one commenter said. “He only asked her phone number . She didn’t know for what reason. I think it can be because he got her trust he wanted to be friends. Think positively.. Is asking the phone number from a girl also sexual harassment?” was another. “This is just attention-seeking,” was another. It appeared that many of the young men commenting did not perceive street harassment as a serious issue.
Nor does the police, it would appear. Although our aim was to map street harassment, similar to in 2016, we were simply unable to do so. And the issues go beyond data-collection.
While conducting research on technology-based violence, Groundviews was told that the police and CID often cause fresh trauma to those who do attempt to receive some form of redress. It is not inconceivable that the same applies to violence offline as well.
Digitising the police logs, for instance, could help ensure statistics on street harassment are more accurately captured and reduce the possibility of double-counting or human error (as well as make it easier to share statistics between different units). Effective gender sensitisation programmes for the police force and other members of the criminal justice system and comprehensive sexual and reproductive health/relationship education at the school level could also help address the hidden societal prejudices that ultimately prevent people from reporting incidents to the police. These suggestions have long been made, with very limited progress.
At present, those who file complaints, including around sexual abuse and violence, are met with a system that is not designed for, or responsive to their needs.
This needs to be addressed, and urgently.
Editor’s Note: Also read “Mapping Street Harassment this Women’s Day“.
