
Photograph via Colombo Gazette
Further to the initial forecast I made in my previous article (Groundviews, 1st January 2015), in this article I make several projections about the possible result in the forthcoming presidential election based on previous election results. I primarily use percentages from the 2010 Presidential election result, 2005 Presidential election result and the 2014 Uva Provincial Council result, in particular the result of the Badulla district, for this purpose.
As can be seen from the Table 1, MR received more than 50 percent of votes in all provinces except in the Northern province in 2010 elections. In the 2005 Presidential elections, he received more than 50 percent in 11 districts (see Column I, Table 2).
Given the fact that 2010 Presidential election marks the pinnacle of his popularity and all other factors that has emerged since negatively impacting on his ability to command a similar result in the current election including the fact that he changed the constitution to seek a third term, it is not logical to assume that he will increase his vote percentage in the 2015 election from what he received in 2010. Instead, what we can expect is a decline in the percentage of votes countrywide for MR. In some provinces and districts within them he may still perform well above 50% mark and in others he will perform well below 50%.
The key question then is how much decline in his vote percentages is required for him to fall below 50%? If we use 2010 figures, several projections can be made. We could calculate the change/decline in votes in percentage terms when we apply specific numbers such as 3%, 6%, 9% or 12%.
Projection I
Table I – Percentage Votes Received by Mahinda Rajapakse in the 2010 Presidential Election together with Several Different Scenarios
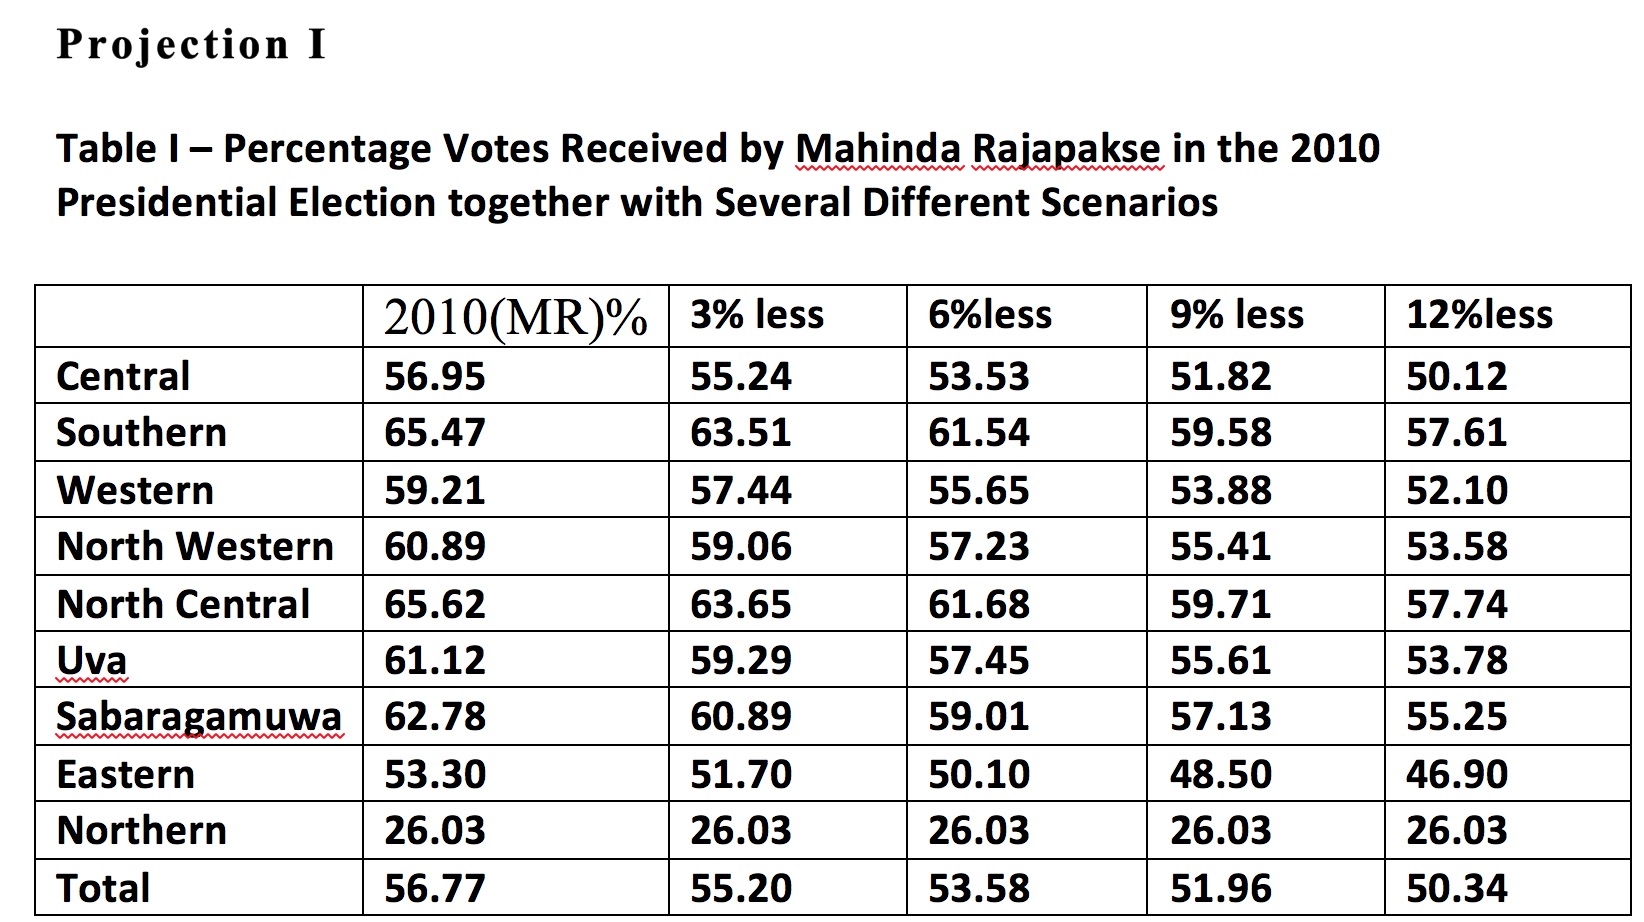
Note: Official figure for MR in the 2010 election was 57.88 and for Sarath Fonseka 40.15%. In the above calculations, I used Provincial figures from the Elections Department Web site. When added up, the total is marginally below the official total.
Looking at these percentages of results obtained from the Department of Elections web site and the projections, even if MR obtains 12% less votes in the forthcoming election, he would still get 50.34% of the total votes. If he gets 9% less vote percentages this time, he could still perform at 51.96% of the total votes polled. Under a 12% vote decline scenario, he would perform below 50% only in the Eastern and Northern provinces. Even a 15% decline in the votes for MR will make him vulnerable only in three provinces, i.e. Central, Eastern, and Northern. Thus, if we use 2010 election results as the basis of projections, it is highly biased toward the incumbent as it represents a high water mark in the electoral cycle with unique characteristics that brought him success. Therefore, we need to employ a different method for projecting the result of current election.
On the surface, above scenarios are quite challenging for the common candidate of the opposition parties. However, political dynamics have changed since the 2010 Presidential elections and certainly after the declaration of the new election in 2015. A strong opposition coalition has rallied around clear goals including those that relate to constitutional, electoral, and governance changes within the first 100 days. Media reports indicate that there is a real contest this time unless the voting is not disturbed by violence and other events during the remaining few critical days.
Projection II
Some argue that 2005 Presidential election result is a better base one can use to predict the results of the forthcoming election rather than the 2010 result due to the reasons explained earlier. For this reason, the percentage votes obtained by MR in the 2005 Presidential election together with several scenarios of decline or gain in votes are presented in Table 2. Instead of Provincial figures, I am using District figures for 22 districts – as the former is not available in the Elections Department website.
Table 2 – Percentages of Votes Obtained by Mahinda Rajapakse in the 2005 Presidential Elections together with Several Scenarios
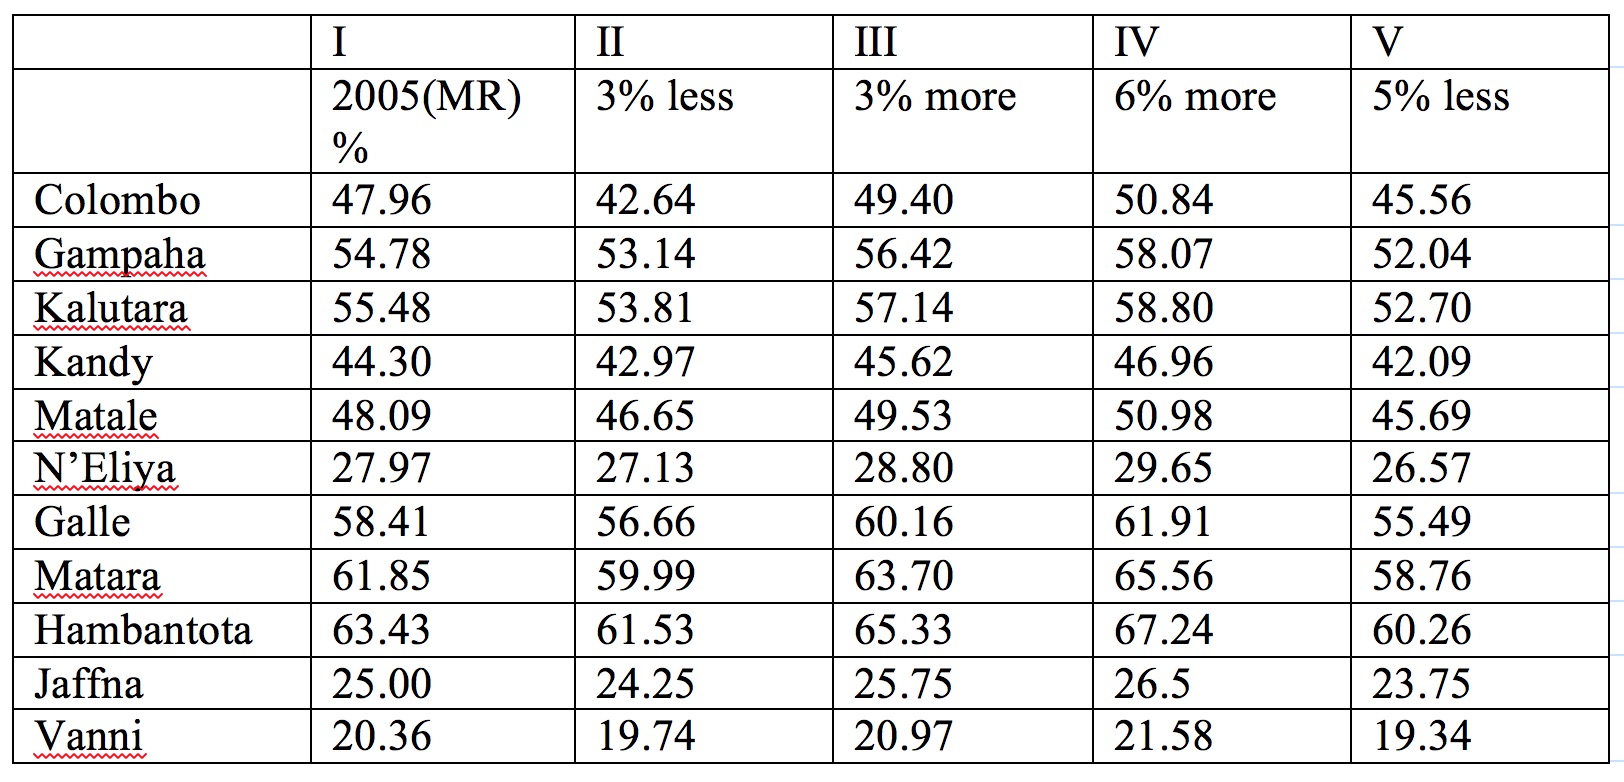
Note: MR won the 2005 Presidential election with a total vote of 50.29%. However, in the above table when district vote percentages are tallied we get a figure somewhat less than this, ie. 46.39%. The method I used was to add district level percentages and divide by the number of districts to get the average.
Column IV: Actual votes in the districts of Jaffna, Vanni, Batticaloa and N’Eliya may be higher in the 2015 election, though I am using projected percent increase here uniformly across all districts.
The question to ask here is whether MR will get less than what he polled in the 2005 Presidential election? Normally, when a candidate wants to contest a national election for a third term, it is logical to assume a decline in votes –unless there are factors contributing to the popularity of the candidate since the previous election. In the case of MR this is a contestable question. There are factors contributing to his popularity. On the other hand, there are factors contributing to his unpopularity also. On balance, the latter weighs heavily on him this time.
If he polls 3-5% less than what he polled in the 2005 Presidential election this time, he will fall well below 50% mark that is required (see Column IV, Table 2). On the other hand, if he polls 3-6% more compared to what he received in 2005, he will move well above the 50% mark.
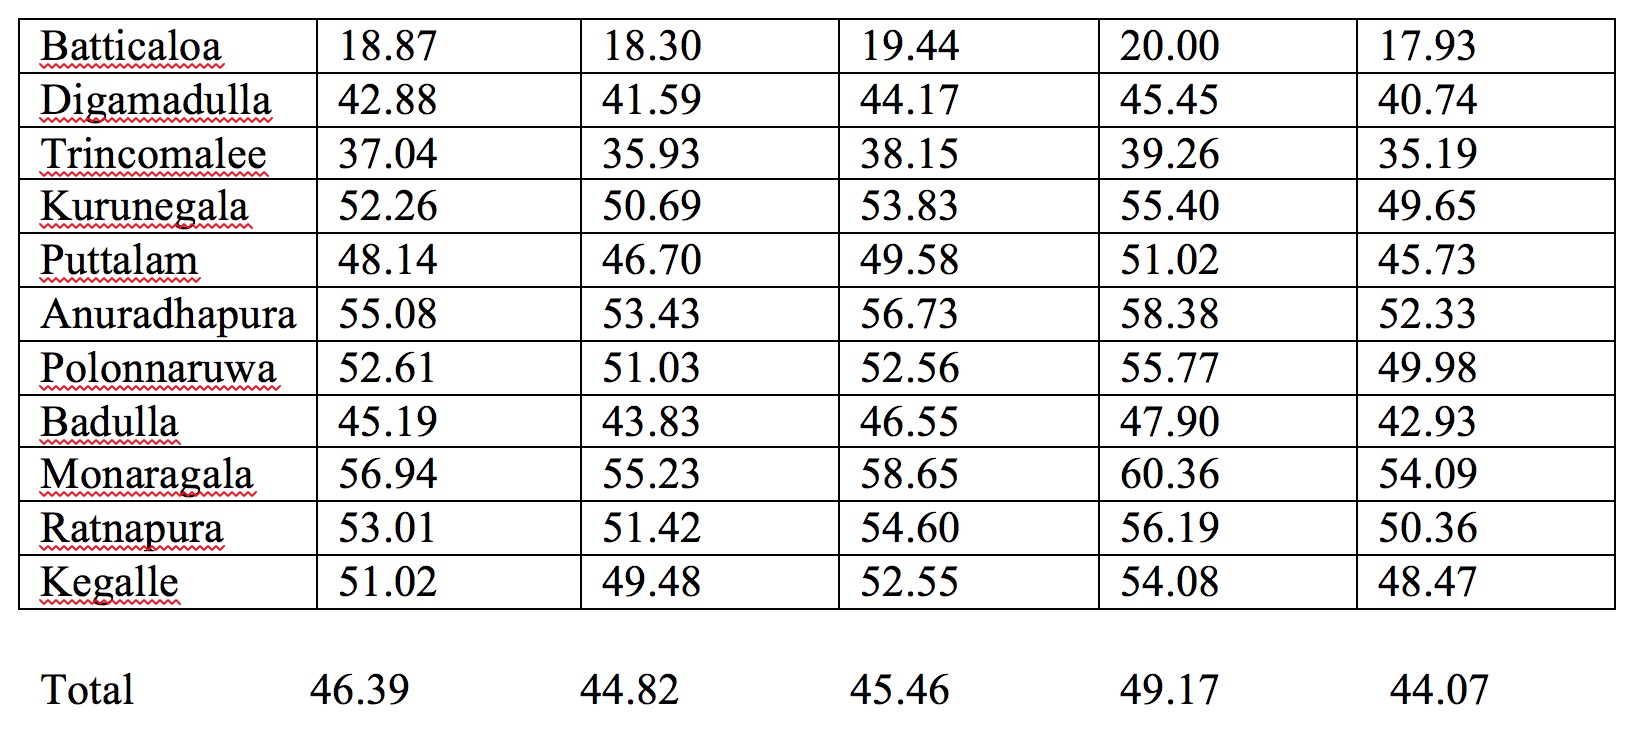
Looking at Column IV in Table 2, vulnerable districts for him thus include Colombo, Kandy, Matale, Nuwara Eliya, Jaffna, Vanni, Batticaloa, Digamadulla, Trincomalee, Puttalam, Badulla and Kegalle. MR’s strength lies in districts such as Gampaha, Kalutara, Galle, Matara, Hambantota, Anuradhapura, Monaragala, and Ratnapura. However, due to recent defections from the SLFP and the ruling coalition, districts such as Kalutara and Anuradhapura have become vulnerable for him.
On the otherhand, it is not possible to assume with reason that MR will poll below what he polled in the 2005 Presidential election. If at all, he may increase the vote percentage from the 2005 figures in many districts. To assume that he will poll less than 2005 figures is to pay a blind eye to all what he has done in terms of the war victory, infrastructure development (irrespective of various charges of corruption by the opposition), and increase in his popularity among certain sectors, basically rural electorate, due to the provision of infrastructure facilities, education and health facilities and communication facilities. Thus the more realistic scenario is to assume that this time his vote percentage will increase from the 2005 levels.
Columns III and IV in Table 2 provide percentages assuming that his votes increase by 3 or 6 percentage points from the 2005 levels. Column IV shows that with a 6% increase from the 2005 levels, MR will fall below 50% mark in 8 districts, i.e. Kandy, Nuwara Eliya, Jaffna, Vanni, Batticaloa, Digamadulla, Trincomalee, and Badulla. It is noteworthy that the percentage increase in MR’s overall votes between 2005 and 2010 elections was 7.71.
If we use above-mentioned projection, it is probable that MR can win the election with 50.00% or more votes this time. However, we have to remember that 2005 was far too distant a context to make predictions about an election being held in 2015 on its own. Factors that contributed to 2005 victory were quite different even from the factors that contributed to 2010 victory by MR. Furthermore, the voter patterns and intentions may differ significantly this time compared to both 2005 and 2010 Presidential elections for a variety of reasons.
Thus we need to find another way of utilising a more recent context or an index as a base to project the possible outcome of 2015 election. This is attempted under Projection III.
Projection III: Using 2014 Badulla Provincial Council result as a Barometer
Some commentators have cited Uva Provincial Council election result as a watermark in the electoral cycle of Sri Lanka mainly because the opposition parties performed better compared to other Provincial Council elections, particularly in the Badulla district. A notable feature of this result is that the combined result by three opposition parties passes the critical 50% mark –though the UNP itself could not achieve this outcome on its own. The number of votes obtained in Badulla district at the Uva PC election 2014 by the UNP (44.79), People’s Liberation Front (4.67) and the Democratic Party (0.73) comprise a total of 50.6 percent of valid votes (In the 2005 election, the UNP received 53.11% in the Badulla district).
If the common opposition candidate Sirisena is to win the 2015 Presidential election, at the minimum he has to obtain a voter percentage of 50%, preferably more.
Thus it makes sense to use this combined opposition party result in the Badulla district in 2014 PC election as a benchmark to estimate the chances of the common opposition gaining a majority of over 50% in the current election. For this purpose, we can still use the 2005 Presidential election results (percentages) as a base-knowing its limitations. This has its own limitations as the voting patterns countrywide may have substantially changed since 2005. However, given the fact that 2010 Presidential election was a high voter mark for MR as explained earlier and thus biased in his favour, it is better to use 2005 election results as it reflects a more conservative context where an emerging leader like Sirisena was contesting the election against many odds.
Scenario I
In this scenario, we can utilise the percentage difference or gap between what the combined opposition obtained in Badulla at the PC elections – 2014(50.19%) and what MR obtained in Badulla district at the 2005 Presidential election (45.19%) as a basis for the third projection.
The 50.19 figure achieved by the combined opposition in the 2014 PC elections in Badulla represents an additional 5% compared to the vote percentage that MR obtained in the Badulla district in 2005 Presidential election. The closest column to this figure in table 2 above is column IV with a 6% increase from the 2005 Presidential election results for MR.
To obtain the “projected vote percentages” in each district under this scenario, I apply the difference of 5% to the percentages of votes received by the UNP in the 2005 Presidential Election in all districts (see Column II, Table 3.
Scenario II
From the perspective of the UNP, which is the main opposition party, the 2005 Presidential election reflected a best-case scenario as its national vote percentage (48.43%) was very close to MR’s (50.29%) reflecting a gap of only 1.86%. In the Uva PC Council election UNP was able to gain only 40.24% compared to UPFA’s 51.24% reflecting a gap of 11%. In the Badulla district, the UNP received 44.79% while UPFA received 47.37%. This reflects a gap of 2.58%. The gap between the two is narrower in the Badulla district compared to the overall Uva result (2.58% compared to 11%). During the 2010 Presidential election, MR received 51.57% and Sarath Fonseka 46.67% in the Badulla district. This represents a gap of 4.9%.
However, as explained under scenario I, in the 2014 PC election the opposition parties that include UNP, PLF, and DP (44.79+4.67+0.73= 50.19) received in the Badulla district reflects a different picture.
Will the common opposition be able to muster the same result as in the Badulla district or double that vote percentage nationally this time? Column II in Table 3 provides projections for a 5% increase compared to the 2005 Presidential election result. Column III, Table 3 gives the projections for a 10% increase in the vote percentage for the common opposition based on the votes that the UNP received in the 2005 Presidential election. The results can give an indication of which districts are favourable to Sirisena.
Table 3 – Percentage of Votes received by the UNP in the 2005 Presidential Election by District and Two Projections
| I% Votes (UNP) 2005 | II (Add 5%) | III (Add )10% | |
| Colombo | 51.12 | 53.676 | 56.232 |
| Gampaha | 44.23 | 46.441 | 48.653 |
| Kalutara | 43.20 | 45.36 | 47.52 |
| Kandy | 44.30 | 46.515 | 48.73 |
| Matale | 50.25 | 52.762 | 55.275 |
| N’Eliya | 70.37 | 73.888 | 77.407 |
| Galle | 40.26 | 42.273 | 44.286 |
| Matara | 36.71 | 38.545 | 40.381 |
| H’tota | 35.23 | 36.991 | 38.753 |
| Jaffna | 70.20 | 73.71 | 77.22 |
| Vanni | 77.89 | 81.784 | 85.679 |
| Batticaloa | 79.51 | 83.485 | 87.461 |
| Digamadulla | 55.91 | 58.705 | 61.501 |
| Trincomalee | 61.33 | 64.396 | 67.463 |
| Kurunegala | 46.72 | 49.056 | 51.392 |
| Polonnaruwa | 50.71 | 53.245 | 55.781 |
| Badulla | 53.11 | 55.765 | 58.421 |
| Monaragala | 41.65 | 43.732 | 45.815 |
| Ratnapura | 45.55 | 47.827 | 50.105 |
| Kegalle | 47.67 | 50.053 | 52.437 |
| Puttalam | 50.74 | 53.277 | 55.814 |
| Anuradhapura | 43.62 | 45.801 | 47.982 |
Total 48.43% 54.42% 57.01%
Note: No other minor party obtained votes in any district above one percentage point in the 2005 Presidential election. The result in N’Eliya in 2015 can be less than what is projected here due to the Ceylon Workers Congress supporting MR.
Under scenario I (i.e. 5% increase), the 12 districts where the UNP (by implication common candidate Sirisena) will poll above 50% are Colombo, Matale, Nuwara Eliya, Jaffna, Vanni, Batticaloa, Digamadulla, Trincomalee, Polonnaruwa, Badulla, Kegalle and Puttalam. In reality, we can add a few more districts to this list given the political dynamics in the 2015 election compared to 2005 election, e.g. Anuradhapura.
Under Scenario II (10% increase), the UNP (or the common opposition currently) will poll 50% or more in 14 districts, i.e. Colombo, Matale, Nuwara Eliya, Jaffna, Vanni, Batticaloa, Digamadulla, Trincomalee, Kurunegala, Polonnaruwa, Badulla, Ratnapura, Kegalle and Puttalam. We can add Anuradhapura also to this list.
On the basis of this calculation, it is reasonable to assume that if the common candidate is to win the Presidential election in 2015, he needs to obtain at least 5% more than the vote percentages that the UNP received district-wise in the 2015 Presidential election. The UNP candidate received only 44.79% of votes in the Badulla district in the 2014 Provincial Council election. The combined opposition received more than 50% in the Badulla district in the 2014 PC Council election as shown already.
This would mean that MR has to poll approximately 5-6% less when using 2005 results as the basis. Figures for this scenario for MR are calculated in Table 2, Column V. In this scenario, MR would receive a total of only 44.07% of the valid votes (the UPFA received 47.37% of votes in Badulla in the 2014 Provincial Council election).
Summary and Conclusion
This paper considered three projections of the probable election results based on 1) 2010 Presidential result percentages, 2) 2005 Presidential result percentages, and 3) a projection based on the results obtained by the UNP, People’s Liberation Front (PLF) and the Democratic Party (DP) combined in the 2014 Uva Provincial Council election Badulla district results set against the district-wise vote percentages that the UNP received in the 2005 Presidential election.
The 2010 election results were considered as too biased toward the incumbent to draw reasonable projections as they represent the pinnacle of MR’s popularity as the election was held in the aftermath of the war victory in 2009. Results of the 2005 election were considered though it was seen as a far distant context to use as a basis on its own for credible projections. Nonetheless, the outcome of various scenarios was discussed. It was however deemed necessary to refine the projection method by using a different formula that combines an outcome from the Uva Provincial Council election 2014.
The use of Badulla combined opposition party result (UNP, PLF, DP) in the 2014 PC election as a basis was considered as the most realistic context to use for a logical projection. This result was contrasted with a projected result with a 5% increase in the vote for the common opposition from a base vote percentage received by the UNP in 2005(Column II, table 3). A 10% increase in the vote percentage received by the UNP in 2005 Presidential election was projected as a second scenario (Column III, Table 3). Results indicate a significant rise in the potential outcome for the combined opposition in the 2015 election as many districts reflect a favourable result beyond 50% for the common opposition/candidate.
However, these are calculations based on certain percentage differentials only. Nonetheless, they provide clues to what is possible and plausible in the forthcoming election.
Ground realities have changed in various districts with the recent defections, the way the government’s development initiatives have affected or not affected, perceptions of the two leaders and coalitions formed by the voters on the basis of various media representations and messages being delivered through public meetings, party and leader symbols etc. If the electorate is confused, it can deliver a significantly different result to 2005, 2010 Presidential elections. By the same token, if the experience of the voter in the cities and villages match with what one coalition is saying against what the other is saying, this can deliver a clear result one way or another.
It is this author’s considered view that the common candidate Maithripala Sirisena will be able to garner a 5-10% increase in the vote percentages in a majority of districts –compared to what the UNP received in the 2005 Presidential election- that will deliver a victory for him and his coalition in the 2015 Presidential election.
Dr. Siri Gamage, University of New England, Australia