
Image courtesy Colombo Gazette
The Per Capita Income (PCI – average annual income per person) is derived by dividing the Gross National Product/Income (GNP/I) of a country by the total population of a country during a given period of time. It is a commonly used yardstick for practical and analytical purposes. However, it is important to understand that the per capita income of a country does not necessarily indicate the level of development of that country. For example, according to the World Development Indicators 2012 of the World Bank, while the Per Capita Income of Cuba was $5,520, PCI of India was $1,270, PCI of Timor-Leste was $2,220, and Sri Lanka’s Per Capita Income was $2,240 in the year 2010. The foregoing figures do not imply that Cuba is economically better-off than India or Sri Lanka; similarly it does not imply that Sri Lanka is economically better-off than India, and Sri Lanka and Timor-Leste are on par in terms of economic development.
According to the World Development Indicators 2012 of the World Bank, countries are classified as follows using the World Bank Atlas method. All the data in the WDI 2012 pertains to the calendar year 2010. These benchmark figures are revised upwardly every year.
- Low-income economy – $1,005 or less GNI (Gross National Income) per capita in 2010
- Lower middle-income economy – $1,006 – $3,975 GNI per capita in 2010
- Upper middle-income economy – $3,976 – $12,275 GNI per capita in 2010
- High-income economy – $12,276 or more GNI per capita income in 2010
In this opinion piece the Per Capita Income of Sri Lanka in 2010 and 2011 are taken for critical appraisal because the real growth in the Gross Domestic Product (GDP) was 8.0% and 8.3% respectively; two of the three years in which the Sri Lankan economy recorded 8.0% or higher growth in the post-independence period.
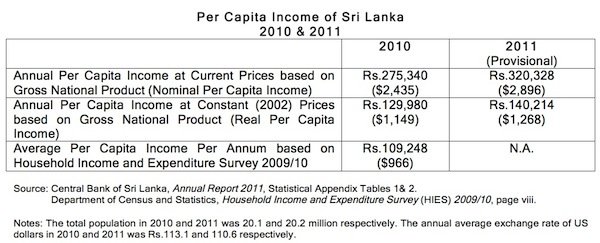
The Per Capita Income determined by the above method is misleading, because it is worked out at current market prices. For example, the Gross National Product (GNP) at current prices (Rs. 5,534,327 million) in 2010, which is called the nominal GNP, is divided by the total population (20.1 million) in 2010. This gives an annual Per Capita Income of Rs. 275,340 ($ 2,435 – at the annual average exchange rate of $1 = Rs.113.1) in 2010. In the same way, the provisional Gross National Product (GNP) at current prices (Rs. 6,470,617 million) in 2011, which is called the nominal GNP, is divided by the total population (20.2 million) in 2011. This gives an annual Per Capita Income of Rs. 320,328 ($ 2,896 – at the annual average exchange rate of $1 = Rs.110.6) in 2011.
On the other hand, if we use the GNP at constant (2002) prices (Rs. 2,612,603 million), which is called the real GNP, the annual Per Capita Income in 2010 was Rs. 129,980 ($ 1,149). Similarly, if we use the provisional GNP at constant (2002) prices (Rs. 2,832,318 million), which is called the real GNP, the annual Per Capita Income in 2011 was Rs. 140,214 ($ 1,268). This is a more realistic measure of Per Capita Income because it takes into account the rise in prices, i.e. inflation (as measured by the GDP deflator).
Moreover, according to the latest Household Income and Expenditure Survey (HIES) undertaken by the Department of Census and Statistics (DCS) between July 2009 and June 2010, the Annual Average Per Capita Income was Rs.109,248 ($966 – at the annual average exchange rate of $1 = Rs.113.1 in 2010).
The HIES 2009/10 figures pertain to most parts of the country, but not the entire country. There are, of course, district-wise variations in the above figures as well. The HIES 2009/10 was conducted among a representative sample of households in 19 out of 25 districts in the country. All the five districts in the North and Trincomalee district in the East were not covered by this survey. Therefore, it does not cover the entire country.
There are disadvantages and advantages of HIES over the National Income Accounts. Since HIES is a representative sample survey it does not cover each and every household in the country, which is a disadvantage. The advantage of HIES is that it covers the informal economy as well, in addition to the formal economy. In the case of the National Income Accounts, it covers only the formal economy and the informal economy is not accounted for. Therefore, the National Income Accounts could be an underestimation of the actual total income of the country.
Furthermore, the Per Capita Income worked-out from the National Income Accounts is deceptive because it includes the incomes of households, government, and industries in a country and the incomes of the government and industries may not necessarily filter down to the household incomes. In contrast, the HIES accounts for solely the incomes and expenditures of the households, which is the real disposable income of households and by extension individuals. Hence, a significant part of the Per Capita Income derived from the National Income Accounts is ghost income as far as the households and individuals are concerned; which is reflected in the significant discrepancy between the Per Capita Income derived from the two sources, viz. the HIES and NIAs. (See Table)
Therefore, we would argue that the Per Capita Income derived from the HIES is what relatively better reflects the real well-being of the people of a country. Hence, the politicians should stop duping the masses with spurious claims of prosperity and welfare.
Muttukrishna Sarvananthan is a Development Economist by profession and the Principal Researcher of the Point Pedro Institute of Development, Point Pedro, Northern Province. His research publications can be viewed at http://scholar.google.com/ He can be contacted at [email protected]